MAKE A MEME
View Large Image
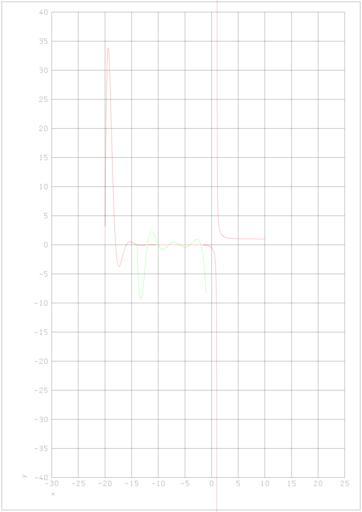
| View Original: | ZetaM20P10R300.png (2314x3274) | |||
| Download: | Original | Medium | Small | Thumb |
| Courtesy of: | commons.wikimedia.org | More Like This | ||
| Keywords: ZetaM20P10R300.png Graph of w Riemann zeta function between -20 and +10 red curve The green curve between -13 and -1 is the graph of 100 zeta x High resolution 2 314 × 3 274 Own 2006-08-30 brf no Copyright because of own work see also thumb 400px right Graph showing only the 1st quadrant from 0 to 10 thumb 400px right A lower-resolution version 297 × 420 - Riemann zeta function GFDL Cc-by-sa-3 0-migrated Cc-by-sa-2 5 2 0 1 0 | ||||