MAKE A MEME
View Large Image
| View Original: | WMAP_5_year_CMB_Power_Spectra.png (2048x1381) | |||
| Download: | Original | Medium | Small | Thumb |
| Courtesy of: | commons.wikimedia.org | More Like This | ||
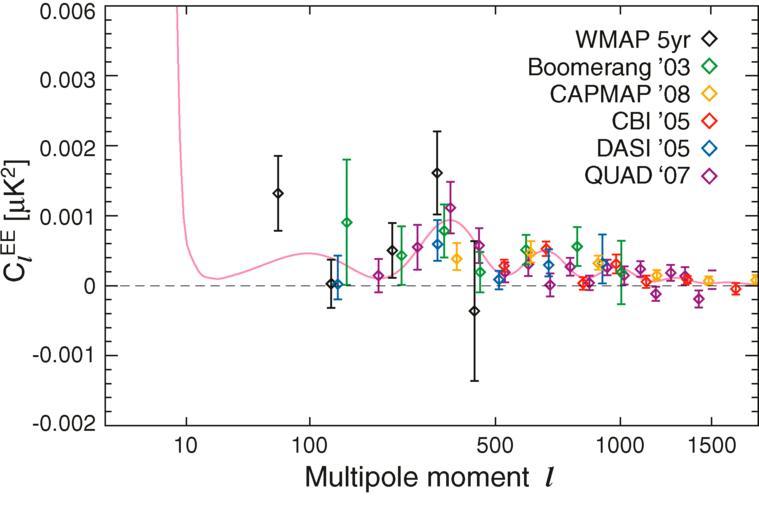
| Keywords: WMAP 5 year CMB Power Spectra.png WMAP 5-year EE power spectrum compared with results from the Boomerang Montroy et al 2006 green CBI Sievers et al 2007 red CAPMAP Bischoff et al 2008 orange QUAD Ade et al 2007 purple and DASI Leitch et al 2005 blue experiments The pink curve is the best-fit theory spectrum from the ΛCDM/WMAP Markov chain Dunkley et al 2008 http //lambda gsfc nasa gov/product/map/pub_papers/fiveyear/power_spectra/wmap_mn5_images cfm 03/18/08 M Nolta et al 2009 ApJS 180 296-305 U S Goveernment http //lambda gsfc nasa gov/product/map/pub_papers/fiveyear/power_spectra/wmap_mn5_images cfm PD-USGov Cosmic microwave background | ||||