MAKE A MEME
View Large Image
| View Original: | US granted software patents.png (970x694) | |||
| Download: | Original | Medium | Small | Thumb |
| Courtesy of: | commons.wikimedia.org | More Like This | ||
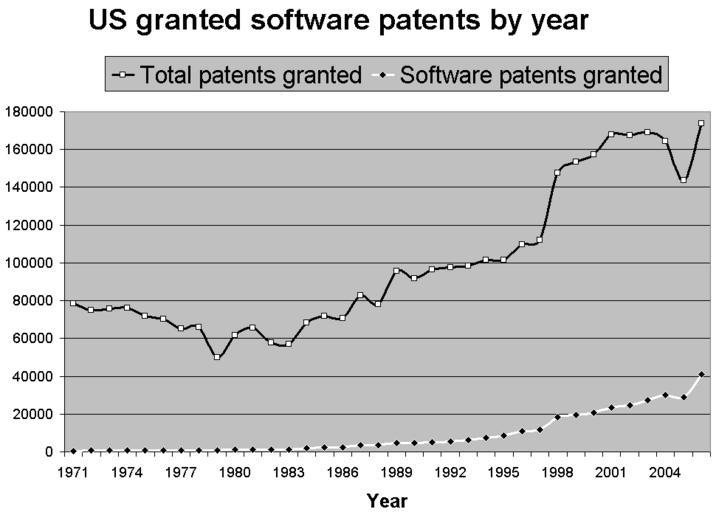
| Keywords: US granted software patents.png Graph using data obtained from the USPTO website showing the total number of patents granted per year since 1971 against the number of software patents granted per year Software patents were identified using a technique proposed by Bessen Hunt and described in List of software patents Specifically the following search was run in the USPTO patent database for values of x between 1971 and 2006 ISD/ 1/1/x->1/1/x+1 AND SPEC/ software OR computer AND program AND APT/1 ANDNOT TTL/ chip OR semiconductor OR bus OR circuit OR circuitry ANDNOT SPEC/ antigen or antigenic OR chromatography to obtain the number of software patents Then a similar search was run ISD/ 1/1/x->1/1/x+1 AND APT/1 to obtain the total number of patents over the same period The actual obtained data by this method and illustrated in the graph was as follows 1971 - 550 out of 78317 1972 - 668 out of 74810 1973 - 683 out of 75678 1974 - 683 out of 76278 1975 - 684 out of 72000 1976 - 725 out of 70226 1977 - 838 out of 65269 1978 - 845 out of 66102 1979 - 783 out of 49969 1980 - 1019 out of 61819 1981 - 1210 out of 65771 1982 - 1319 out of 57888 1983 - 1358 out of 56860 1984 - 1888 out of 68329 1985 - 2357 out of 71661 1986 - 2530 out of 70860 1987 - 3384 out of 82952 1988 - 3326 out of 77924 1989 - 4751 out of 95537 1990 - 4555 out of 91882 1991 - 5080 out of 96511 1992 - 5579 out of 97444 1993 - 6425 out of 98342 1994 - 7579 out of 101676 1995 - 8571 out of 101419 1996 - 10818 out of 109645 1997 - 11534 out of 111984 1998 - 18415 out of 147519 1999 - 19457 out of 153489 2000 - 20730 out of 157493 2001 - 23347 out of 168030 2002 - 24550 out of 167325 2003 - 27362 out of 169022 2004 - 30113 out of 164290 2005 - 28900 out of 143805 2006 - 40874 out of 173776 2007 - 38874 out of 185710 not depicted in graph The graph was prepared within Microsoft Excel Own work with data taken from USPTO website 2007-02-15 Geoff Dallimore Public domain Competitiveness Patents charts | ||||