MAKE A MEME
View Large Image
| View Original: | Supercomputing-rmax-graph2.svg (1008x648) | |||
| Download: | Original | Medium | Small | Thumb |
| Courtesy of: | commons.wikimedia.org | More Like This | ||
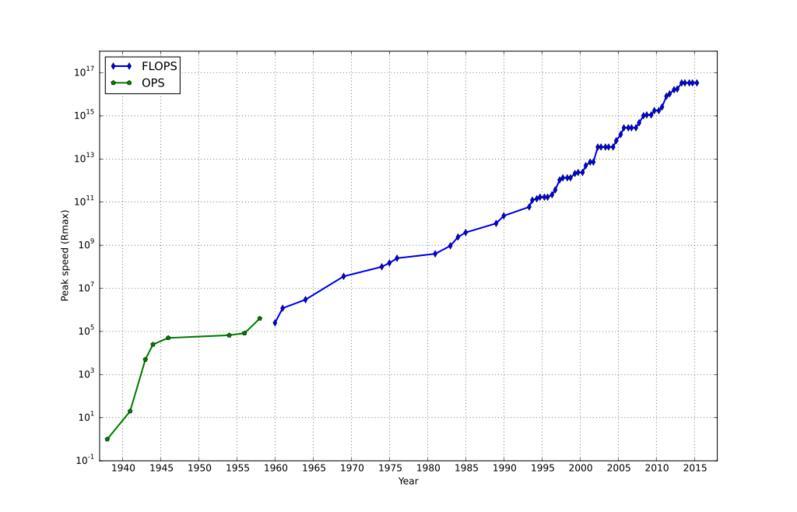
| Keywords: Supercomputing-rmax-graph2.svg en Plot of highest supercomputer performance over time own Morn 2014-05-11 History of computing Supercomputing diagrams Created with Matplotlib Images with Python source code Cc-zero Python source code <source lang python > /usr/bin/env python3 from pylab import use Matplotlib import datetime Data from HTML source at http //top500 org/statistics/perfdevel/ and https //en wikipedia org/w/index php title Supercomputer oldid 380073785 li 1938 1 1941 20 1943 5000 1944 25000 1946 50000 1954 67000 1956 83000 1958 400000 1960 250000 1961 1 2 1964 3 1969 36 1974 100 1975 150 1976 250 1981 400 1983 941 1984 2 4 1985 3 9 1989 10 3 1990 23 2 1993-05-01 59 7 0 42 1128 57 1993-10-01 124 0 47 1493 35 1994-05-01 143 4 0 84 2317 01 1994-10-01 170 1 16 2732 24 1995-05-01 170 1 96 3927 1995-10-01 170 2 49 4784 34 1996-05-01 220 4 3 31 5892 24 1996-10-01 368 2 4 62 7981 24 1997-05-01 1068 7 67 12844 19 1997-10-01 1338 9 51 16898 12 1998-05-01 1338 13 39 22625 14 1998-10-01 1338 17 12 29367 6 1999-05-01 2121 24 7 39062 57 1999-10-01 2379 33 09 50938 56 2000-05-01 2379 43 82 64230 11 2000-10-01 4938 55 3 88082 45 2001-05-01 7226 67 78 108276 78 2001-10-01 7226 94 3 134977 51 2002-05-01 35860 134 3 222263 77 2002-10-01 35860 195 8 291814 16 2003-05-01 35860 241 4 370049 26 2003-10-01 35860 378 6 526740 41 2004-05-01 35860 606 9 812313 21 2004-10-01 70720 840 02 1128834 52 2005-05-01 136800 1166 1694886 64 2005-10-01 280600 1645 7 2299341 68 2006-05-01 280600 2026 2789465 47 2006-10-01 280600 2736 9 3527867 61 2007-05-01 280600 4031 4950600 48 2007-10-01 478200 5937 33 6977593 51 2008-05-01 1026000 8996 78 12152691 08 2008-10-01 1105000 12593 5 17373520 05 2009-05-01 1105000 17110 22640789 57 2009-10-01 1759000 20070 28006450 09 2010-05-01 1759000 24670 32434684 56 2010-10-01 2566000 31124 36 43786881 73 2011-05-01 8162000 40187 29 58930025 84 2011-10-01 10510000 50941 4 74069633 68 2012-05-01 16324751 60824 4 123417786 71 2012-10-01 17590000 76411 162139386 75 2013-05-01 33862700 96619 223654338 13 2013-10-01 33862700 117831 30 250080467 17 2014-05-01 33862700 133700 273763781 09 2014-10-01 33862700 153381 308850512 09 2015-05-01 33862700 164790 72 362652490 36 x1 y1 x2 y2 for line in li splitlines if ' ' not in line continue e line split ' ' if '-' not in e0 m d 1 1 y int e0 else y m d int w for w in e0 split '-' f float e1 if y > 1983 mult 1e9 elif y > 1960 mult 1e6 else mult 1 if y < 1960 y2 append mult f x2 append datetime date y m d else y1 append mult f x1 append datetime date y m d figure figsize 14 9 semilogy x1 y1 label FLOPS lw 2 color blue marker d semilogy x2 y2 label OPS lw 2 color green marker p legend loc upper left xlabel 'Year' ylabel 'Peak speed Rmax ' grid 'on' xticks datetime date y 1 1 for y in range 1935 2040 5 axis datetime date 1937 1 1 datetime date 2018 1 1 1 1e18 savefig Supercomputing-rmax-graph svg show </source> | ||||