MAKE A MEME
View Large Image
| View Original: | Spectra.Classical&Function.jpg (566x300) | |||
| Download: | Original | Medium | Small | Thumb |
| Courtesy of: | commons.wikimedia.org | More Like This | ||
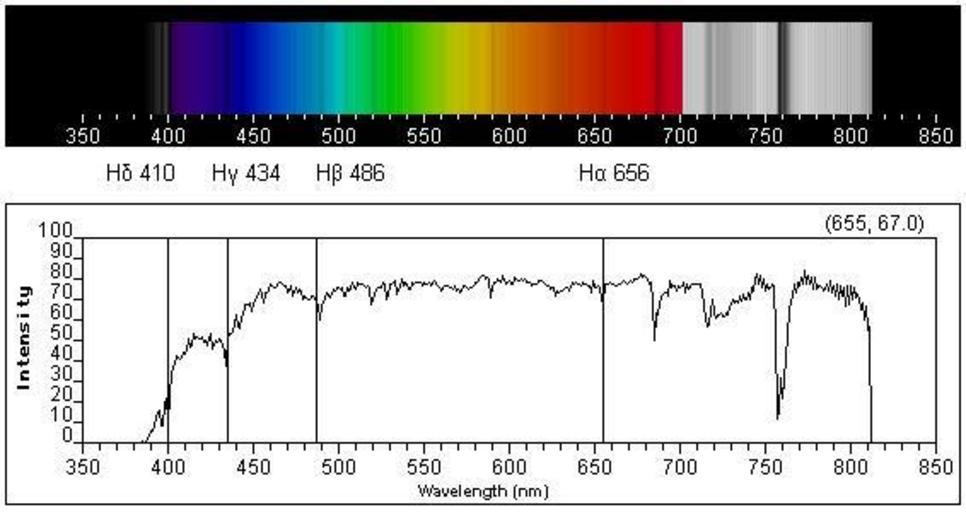
| Keywords: Spectra.Classical&Function.jpg Solar spectrum with Fraunhofer lines corresponding intensity vs wavelength plot IR and UV areas are grayed<br/> Hydrogen Balmer lines Hα-δ are marked as vertical lines <br/> Created with Virtual Spectroscope http //mo-www harvard edu/Java/MiniSpectroscopy html online version Own 2007-11-20 Kurgus Solar spectra | ||||