MAKE A MEME
View Large Image
| View Original: | Simple barplot.svg (722x578) | |||
| Download: | Original | Medium | Small | Thumb |
| Courtesy of: | commons.wikimedia.org | More Like This | ||
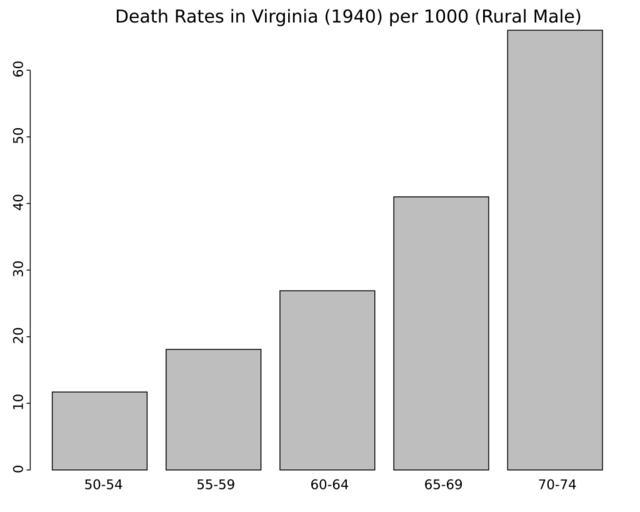
| Keywords: Simple barplot.svg simple barplot created with Gnu R and the use of the VADeaths data set from the Gnu R programm package datasets Darstellung eines einfachen Säulendiagramms erstellt mit Gnu R unter Benutzung vom VADeaths Datensatz des Gnu R Programmpakets datasets own 2007-05-24 Hagezussa further informations Code devSVG file simple_barplot svg barplot VADeaths 1 main Death Rates in Virginia 1940 per 1000 Rural Male cex axis 1 5 cex names 1 5 cex main 2 dev off Commentary For saving in the SVG Format it was necessary to enlarge axis names and main Data set VADeaths from the Gnu R programm package datasets Manual title R A Language and Environment for Statistical Computing author R Development Core Team organization R Foundation for Statistical Computing address Vienna Austria year 2007 note ISBN 3-900051-07-0 url http //www R-project org Source Moyneau L Gilliam S K and Florant L C 1947 Differences in Virginia death rates by color sex age and rural or urban residence American Sociological Review 12 525 “535 References McNeil D R 1977 Interactive Data Analysis Wiley Created with R GNU R Histograms | ||||