MAKE A MEME
View Large Image
| View Original: | Scatter_plot.jpg (500x500) | |||
| Download: | Original | Medium | Small | Thumb |
| Courtesy of: | commons.wikimedia.org | More Like This | ||
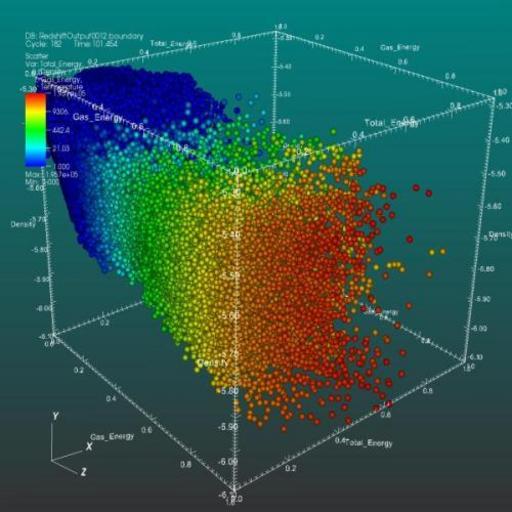
| Keywords: Scatter plot.jpg en Scatter plot VisIt's Scatter plot allows for the visualization of multivariate data of up to four dimensions The Scatter plot takes multiple scalar variables and uses them for different axes in phase space The different variables are combined to form coordinates in the phase space and they are displayed using glyphs and colored using another scalar variable https //wci llnl gov/codes/visit/gallery html Visualizations that have been created with VisIt at wci llnl gov UCRL Updated November 8 2007 PD-USGov Scientific visualization 3D scatterplots | ||||