MAKE A MEME
View Large Image
| View Original: | SAT-math-by-race-ethnicity.png (478x286) | |||
| Download: | Original | Medium | Small | Thumb |
| Courtesy of: | commons.wikimedia.org | More Like This | ||
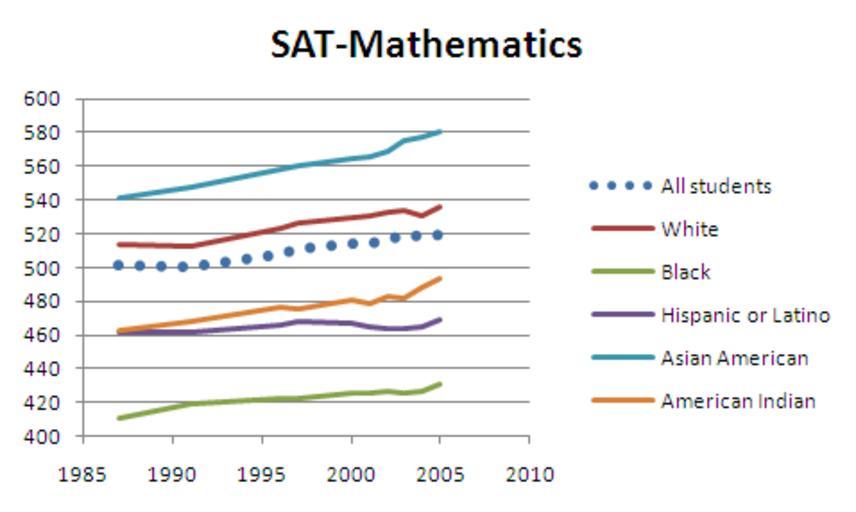
| Keywords: SAT-math-by-race-ethnicity.png en SAT score averages of college-bound seniors by race/ethnicity Selected years 1986-87 through 2004-05 Data source http //nces ed gov/programs/digest/d05/tables/dt05_126 asp SAT-Verbal School year ending 1987 1991 1996 1997 2000 2001 2002 2003 2004 2005 All students 507 499 505 505 505 506 504 507 508 508 White 524 518 526 526 528 529 527 529 528 532 Black 428 427 434 434 434 433 430 431 430 433 Hispanic or Latino 464 458 465 466 461 460 458 457 461 463 Mexican American 457 454 455 451 453 451 446 448 451 453 Puerto Rican 436 436 452 454 456 457 455 456 457 460 Asian American 479 485 496 496 499 501 501 508 507 511 American Indian 471 470 483 475 482 481 479 480 483 489 Other 480 486 511 512 508 503 502 501 494 495 own R O C 2010-05-24 Intelligence SAT test | ||||