MAKE A MEME
View Large Image
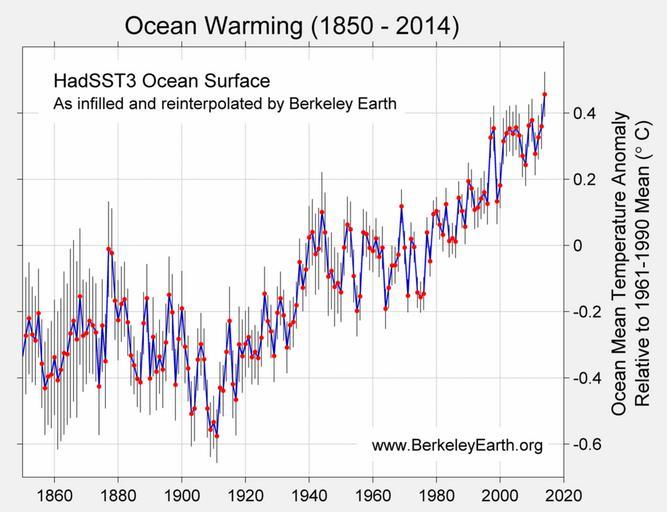
| View Original: | Ocean Surface Averages (1850-2014).jpg (2344x1800) | |||
| Download: | Original | Medium | Small | Thumb |
| Courtesy of: | commons.wikimedia.org | More Like This | ||
| Keywords: Ocean Surface Averages (1850-2014).jpg ber Temperaturveränderung über Ozeanflächen rel zu Mittelwert 1961-1990 2014 0 457 ±0 068°C 2010 0 378 ±0 065°C 2009 0 362 ±0 064°C 2013 0 360 ±0 051°C 2005 0 356 ±0 068°C 1998 0 354 ±0 069°C 2003 0 353 ±0 069°C 2002 0 339 ±0 070°C 2004 0 337 ±0 067°C 2006 0 332 ±0 066°C http //static berkeleyearth org/memos/Global-Warming-2014-Berkeley-Earth-Newsletter pdf 2015-01 Berkeley Earth PD-author Berkeley-Earth Reuse Policy http //berkeleyearth org/contacthttp //berkeleyearth org/faq reuse The authors of the material available on the Berkeley Earth website www berkeleyearth org grant permission free of charge to authors readers and third parties to reproduce their materials as part of another publication or entity with proper sourcing to Berkeley Earth and by additionally providing a link to the Berkeley Earth website http //www berkeleyearth org Berkeley EarthGlobal warming graphsSea surface temperature maps 201412 | ||||
.jpg)