MAKE A MEME
View Large Image
| View Original: | Northern_Hemisphere_Sea_Ice_Extent_Anomalies.png (1260x720) | |||
| Download: | Original | Medium | Small | Thumb |
| Courtesy of: | commons.wikimedia.org | More Like This | ||
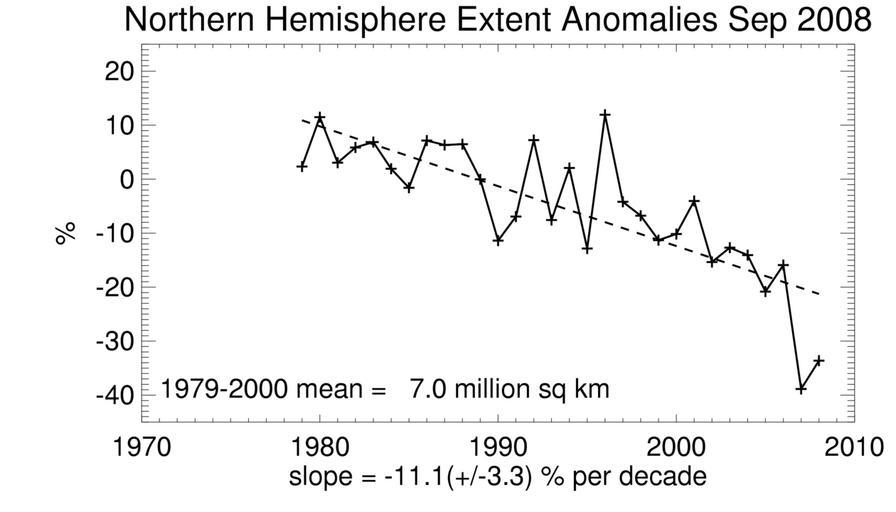
| Keywords: Northern Hemisphere Sea Ice Extent Anomalies.png Trends in Extent Northern Hemisphere Arctic Sea Ice Ice extent anomalies are plotted as a time series of percent differences between the total extent for the month in question and the mean for that month where the mean is based on the January 1979 - December 2000 portion of the data set The trend in percent change per decade is obtained using least squares regression and a 95 confidence interval for the resulting slope is given http //nsidc org/data/seaice_index/n_plot html 2008-05 National Snow and Ice Data Center thumb left graph PD-USGov Regression analysis Statistics for Arctic sea ice melting | ||||