MAKE A MEME
View Large Image
| View Original: | NCSTAR_1-9_Figure_12-77_Page_603.png (853x583) | |||
| Download: | Original | Medium | Small | Thumb |
| Courtesy of: | commons.wikimedia.org | More Like This | ||
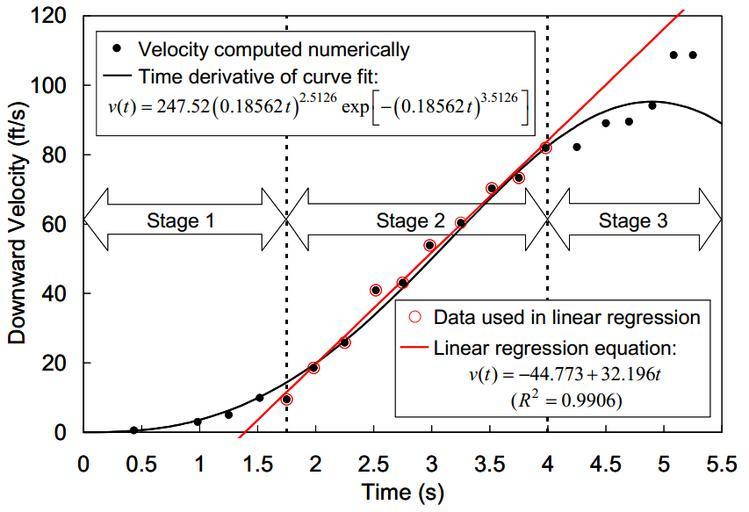
| Keywords: NCSTAR 1-9 Figure 12-77 Page 603.png en Downward velocity time graph of north face roofline as World Trade Center 7 began to collapse on September 11 2001 NIST NCSTAR 1-9 Figure 12-77 Page 603 2008-11-20 NIST NCSTAR 1-9 Figure 12-77 Page 603 Therese P McAllister et al PD-USGov Uploaded with UploadWizard Maps and diagrams of 9/11 7 World Trade Center 2006 | ||||