MAKE A MEME
View Large Image
| View Original: | Mcenter10.jpg (640x480) | |||
| Download: | Original | Medium | Small | Thumb |
| Courtesy of: | commons.wikimedia.org | More Like This | ||
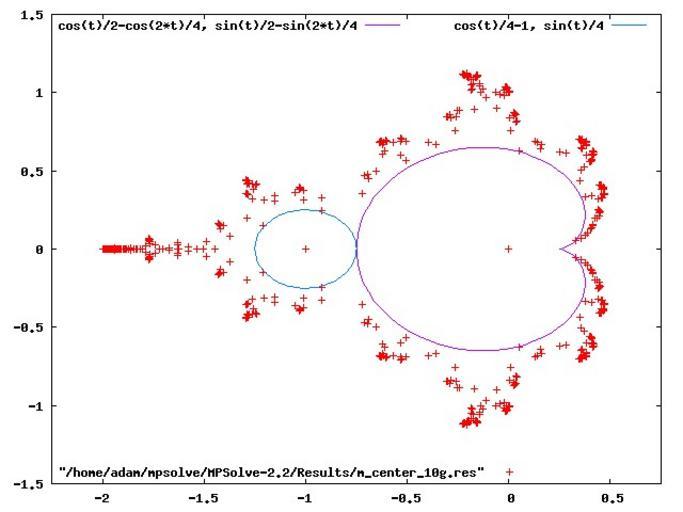
| Keywords: Mcenter10.jpg This file shows centers of hyperbolic components of Mandelbrot set Fc z z z+c for period 10 and its divisors It is made with gnuplot Centers are computed with MPSolve Own 2007-10-30 Adam majewski Compare with http //fraktal republika pl/eigensolve html centers 1-12 made with Maxima Eigensolve and Gnuplot centers of periods 1- 10 made with Maxima and Gnuplot Maxima source code This code draws only boundaries I must add code for drawing points Coordinates of points are read from file load draw draw2d xrange -2 0 5 yrange -1 25 1 25 nticks 200 key main cardioid parametric cos t /2-cos 2 t /4 sin t /2-sin 2 t /4 t - pi pi key period 2 component parametric cos t /4-1 sin t /4 t - pi pi title Mandelbrot set graph Mandelbrot set properties Gnuplot diagrams Images with Maxima CAS source code | ||||