MAKE A MEME
View Large Image
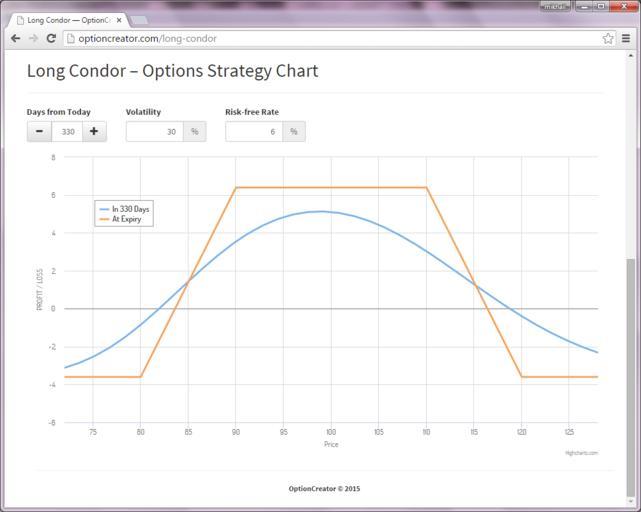
| View Original: | Long Condor Options Strategy Profit-Loss Graph.png (1044x834) | |||
| Download: | Original | Medium | Small | Thumb |
| Courtesy of: | commons.wikimedia.org | More Like This | ||
| Keywords: Long Condor Options Strategy Profit-Loss Graph.png Uploaded with en wp UW marker 2015 07 25 The diagram shows the Profit / Loss Chart of a Long Condor Options Strategy at expiry orange line and 35 days before expiry blue line http //optioncreator com/long-condor OptionCreator com http //optioncreator com/about ;Other information This image is a screenshot taken from a freeware site OptionCreator com OptionCreator com | ||||