MAKE A MEME
View Large Image
| View Original: | Kennet School GCSE grade graph, 1989-2011.png (1127x800) | |||
| Download: | Original | Medium | Small | Thumb |
| Courtesy of: | commons.wikimedia.org | More Like This | ||
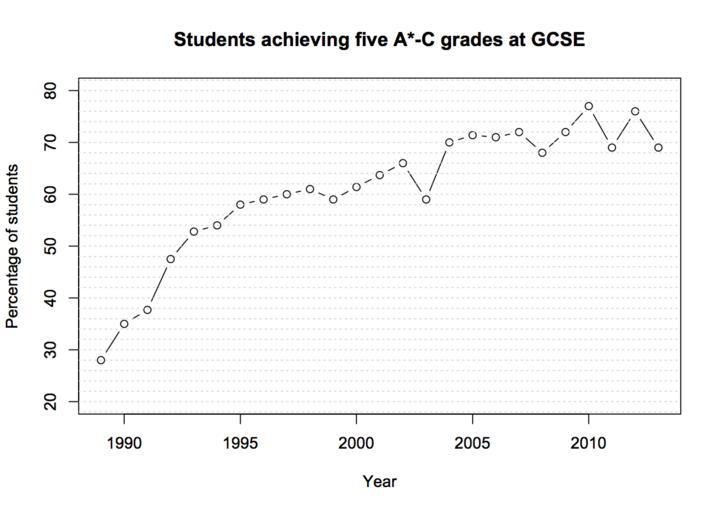
| Keywords: Kennet School GCSE grade graph, 1989-2011.png Uploaded with en wp UW marker 2012 07 09 Graph depicting the percentage of students achieving five A -C grades at GCSE from 1989 to 2013 at Kennet School Created using statistical software R using data from the Wikipedia page sourced from the UK Department for Education 2013-10-06 CR7 Made using code <br> <code>A 1989 2013<br> B c 28 35 37 7 47 5 52 8 54 58 59 60 61 59 61 4 63 7 66 59 70 71 4 71 72 68 72 77 69 76 69 <br> plot A B main Students achieving five A -C grades at GCSE xlab Year ylab Percentage of students type b ylim c 20 80 <br> abline h seq 0 100 2 col lightgray lty dotted </code> cc-zero High schools and secondary schools Education in the United Kingdom Berkshire Thatcham Kennet Comprehensive School | ||||