MAKE A MEME
View Large Image
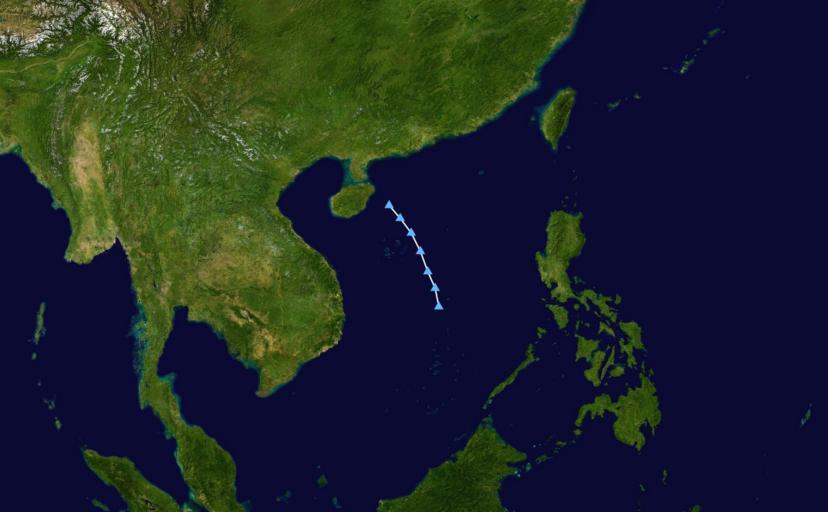
| View Original: | JMA TD 2013 July 94W track.png (1024x633) | |||
| Download: | Original | Medium | Small | Thumb |
| Courtesy of: | commons.wikimedia.org | More Like This | ||
| Keywords: JMA TD 2013 July 94W track.png Track map of JMA Tropical Depression formed July 18 94W INVEST at JTWC of the 2013 Pacific typhoon season The points show the location of the storm at 6-hour intervals The colour represents the storm's maximum sustained wind speeds as classified in the Saffir-Simpson Hurricane Scale see below and the shape of the data points represent the nature of the storm according to the legend below WPTC track map/Table Created using Wikipedia WikiProject Tropical cyclones/Tracks The background image is from NASA Tracking data is from NRL 2013-07-21 Keith Edkins 2013 Pacific typhoon season track maps | ||||