MAKE A MEME
View Large Image
| View Original: | HighSensitivity LowSpecificity cs.png (1401x1050) | |||
| Download: | Original | Medium | Small | Thumb |
| Courtesy of: | commons.wikimedia.org | More Like This | ||
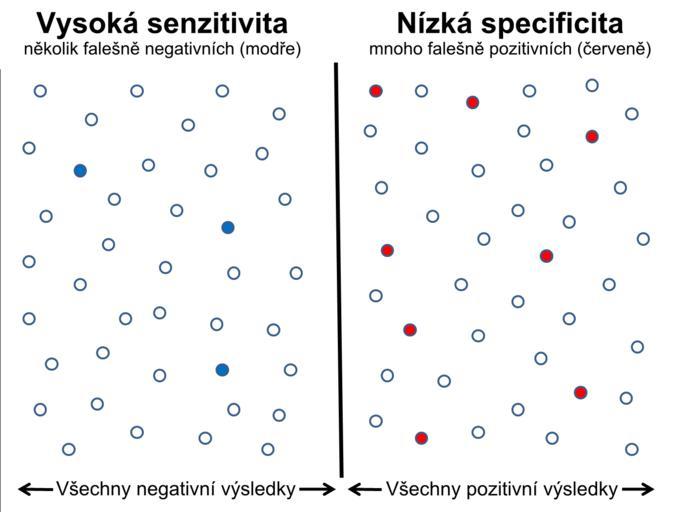
| Keywords: HighSensitivity LowSpecificity cs.png en Graphical illustration of high sensitivity and low specificity Each data point is represented by a circle Data which failed the test are drawn on the left side of the vertical bar and data which passed the test are drawn on the right side of the vertical bar False negatives are shown as closed blue circles in the left panel and false positives are shown as closed red circles in the right panel All other data points open circles are either true negatives on the left or true positives on the right HighSensitivity_LowSpecificity_1401x1050 png 2011-04-27 18 20 UTC HighSensitivity_LowSpecificity_1401x1050 png Rmostell derivative work Icewalker cs <span class signature-talk >talk</span> Czech translation Icewalker_cs HighSensitivity_LowSpecificity_1401x1050 png Cc-zero Original upload log This image is a derivative work of the following images File HighSensitivity_LowSpecificity_1401x1050 png licensed with Cc-zero 2011-03-06T21 55 15Z Rmostell 1401x1050 79016 Bytes <nowiki> en Graphical illustration of high sensitivity and low specificity Each data point is represented by a circle Data which failed the test are drawn on the left side of the vertical bar and </nowiki> Uploaded with derivativeFX Epidemiology Healthcare statistics Numerical analysis Diagrams in Czech | ||||