MAKE A MEME
View Large Image
| View Original: | GlobalMonthlyMeanSurfaceTemperature02.png (664x430) | |||
| Download: | Original | Medium | Small | Thumb |
| Courtesy of: | commons.wikimedia.org | More Like This | ||
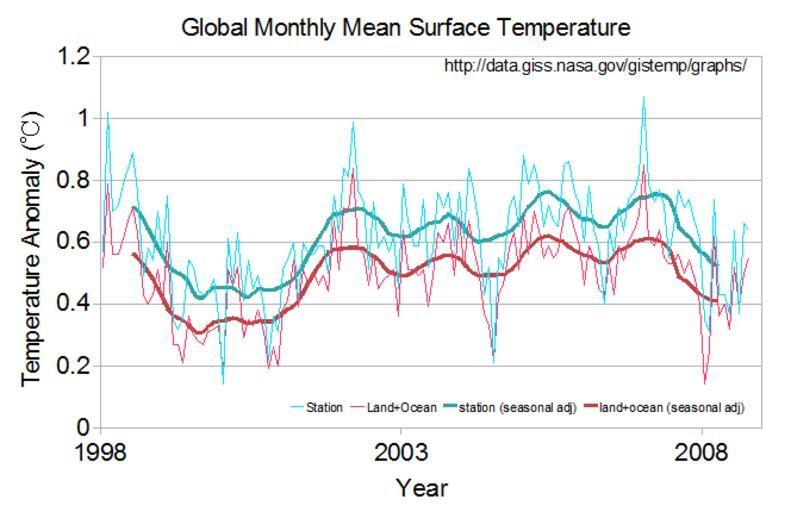
| Keywords: GlobalMonthlyMeanSurfaceTemperature02.png en This plot shows global monthly land-ocean surface temperature change in the latest decade The red line is change observed under meteorological stations and the blue one is the temperature index which includes sea surface temperature obtained from satellite measurements The bold lines are the seasonal adjusted trends GISS Ńü«ŃāćŃā╝Ńé┐ŃüŗŃéēõĮ µłÉ The data obtained from http //data giss nasa gov/gistemp/graphs/ NASA GISS The figure was created by Nkt <span class signature-talk >talk</span> from the data 2008-11-20 Global warming graphs Global Warming Art images | ||||