MAKE A MEME
View Large Image
| View Original: | Empirical CDF.png (412x318) | |||
| Download: | Original | Medium | Small | Thumb |
| Courtesy of: | commons.wikimedia.org | More Like This | ||
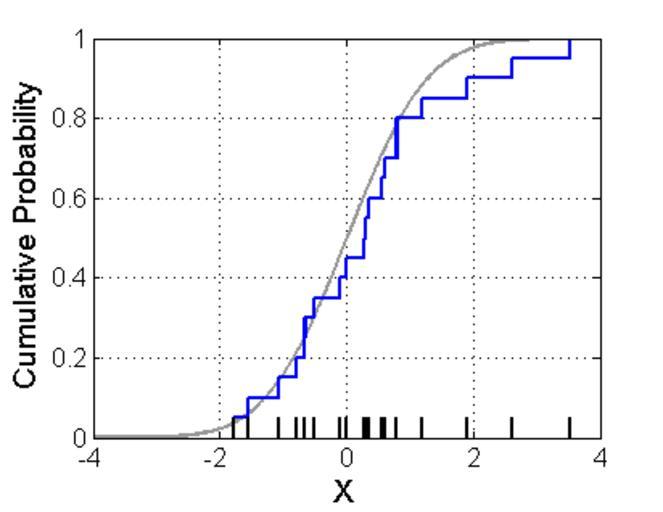
| Keywords: Empirical CDF.png en This is a visualization of an empirical distribution function The black bars shows the samples corresponding to the ecdf and the gray line is the theoretical distribution from which the samples have been drawn 2013-03-25 11 02 44 own Bscan graph <source lang 'matlab'> This is Matlab code to generate a visualization of the empirical distribution function This code released under the CC0 license Generate random samples NumSamps 20; Get standard normally distributed samples samples randn NumSamps 1 ; Get emprical cdf f x ecdf samples ; Get real cdf x_cdf -5 0 01 5; y_cdf normcdf x_cdf ; Generate figure; figure; hold on; plot x_cdf y_cdf '-' 'Color' 0 6 0 6 0 6 'LineWidth' 2 ; stairs x f 'b-' 'LineWidth' 2 ; The 1/NumSamps ensures the black bars are scaled to be probabilities plot samples samples' zeros NumSamps 1 1/NumSamps ones NumSamps 1 ' '-k' 'LineWidth' 2 ; set gca 'FontSize' 12 grid on; box on; xlim -4 4 </source> cc-zero Uploaded with UploadWizard Cumulative frequency distribution Created with MATLAB Images with Matlab source code | ||||