MAKE A MEME
View Large Image
| View Original: | Effective_tax_rates,_US_high-income.png (743x710) | |||
| Download: | Original | Medium | Small | Thumb |
| Courtesy of: | commons.wikimedia.org | More Like This | ||
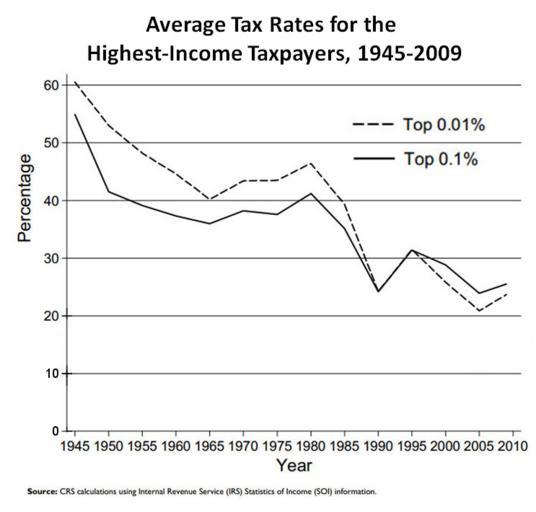
| Keywords: Effective tax rates, US high-income.png en Average tax rate percentages for the highest-income U S taxpayers 1945-2009 The average tax rate for the top 0 01 one taxpayer in 10 000 was about 60 in 1945 and fell to 24 2 by 1990 The average tax rate for the top 0 1 one taxpayer in 1 000 was 55 in 1945 and also fell to 24 2 by 1990 following a similar downward path as the tax rate for the top 0 01 Between 1990 and 1995 the average tax rate for both the top 0 1 and top 0 01 increased to about 31 After 1995 the average tax rate for the top 0 01 was lower than that for the top 0 1 2012-11-15 20 50 00 http //online wsj com/public/resources/documents/r42729_0917 pdf Thomas L Hungerford U S Congressional Research Service <gallery>File US_high-income_effective_tax_rates png</gallery> This plot has been cosmetically adjusted so that the x-axis intercepts the y-axis at 0 PD-USGov Uploaded with UploadWizard Tax in the United States Tax charts Economic inequality | ||||