MAKE A MEME
View Large Image
| View Original: | Division of x pow 2 times y pow 2 by x the sum of pow 4 and y pow 2 towards 0.png (1325x1117) | |||
| Download: | Original | Medium | Small | Thumb |
| Courtesy of: | commons.wikimedia.org | More Like This | ||
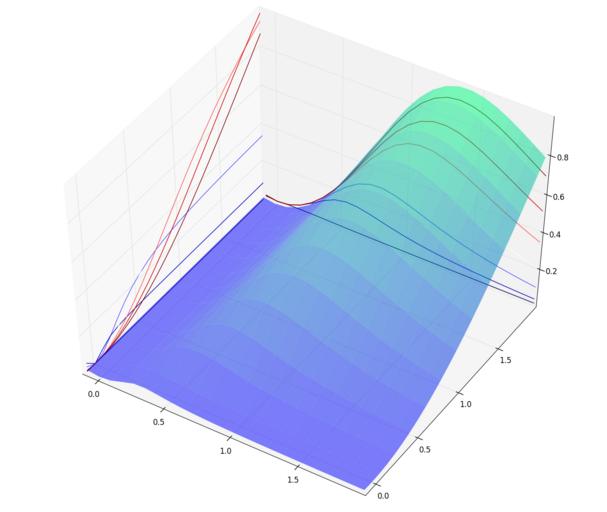
| Keywords: Division of x pow 2 times y pow 2 by x the sum of pow 4 and y pow 2 towards 0.png en 3D plot of the function <math>f x y \frac x 2y x 4+y 2 </math> towards the origin with projections of the curve on the xz and yz plan The lines of the projections are bluest the nearest they are to zero fr Représentation 3D de la fonction <math>f x y \frac x 2y x 4+y 2 </math> vers l'origine munie de projections sur les plans xz et yz Les lignes de la projection sont de plus en plus bleues à mesure que ce sont des projections de la courbe proches de zéro own TomT0m 2016-12-14 Generated with matplotlib with the following python code <syntaxhighlight lang python > from mpl_toolkits mplot3d import Axes3D from matplotlib import cm from matplotlib ticker import LinearLocator FormatStrFormatter import matplotlib pyplot as plt import numpy as np fig plt figure ax fig gca projection '3d' X np arange - 1 2 0 09 Y np arange -0 1 2 0 09 X Y np meshgrid X Y Z X 2 Y 2 / X 4+Y 2 cset ax contour X Y Z zdir 'y' offset 2 cmap cm seismic cset ax contour X Y Z zdir 'x' offset - 1 cmap cm seismic surf ax plot_surface X Y Z rstride 2 cstride 1 cmap cm winter linewidth 0 antialiased True alpha 5 shade False plt show </syntaxhighlight> Polynomial functions Convergence 3D plots Cc-zero | ||||