MAKE A MEME
View Large Image
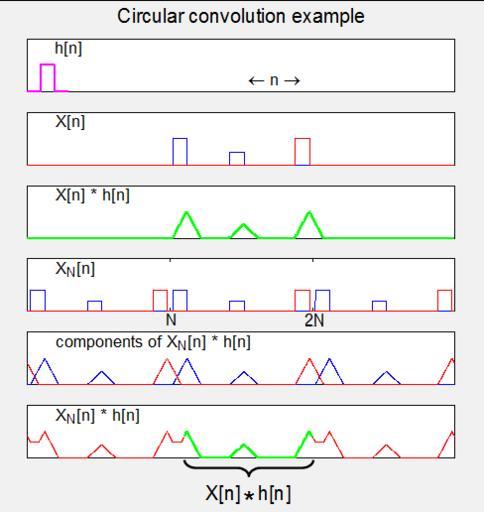
| View Original: | Circular convolution example.png (488x516) | |||
| Download: | Original | Medium | Small | Thumb |
| Courtesy of: | commons.wikimedia.org | More Like This | ||
| Keywords: Circular convolution example.png Illustration of circular convolution Own 2008-04-16 Bob K Octave script <source lang Matlab > graphics_toolkit gnuplot figure 1 'color' 95 1 1 1 xmax 3000; subplot 6 1 1 L 100; f ones 1 L /L; plot -100 200-1 zeros 1 100 f L zeros 1 100 'linewidth' 2 'color' 'magenta' set gca 'color' 'white' title 'Circular convolution example' 'FontSize' 12 text 100 1 6 'hn' text xmax/2 0 4 '\leftarrow n \rightarrow' ylim 0 2 xlim -100 xmax set gca 'XTick' ; set gca 'YTick' subplot 6 1 2 a zeros 1 20 ones 1 L zeros 1 300 0 5 ones 1 100 zeros 1 1000-L-20-400 ; b zeros 1 1000-L-20 ones 1 L zeros 1 20 ; a1 zeros 1 1000 a zeros 1 1000 ; b1 zeros 1 1000 b zeros 1 1000 ; plot 1 length a1 a1 'color' 'blue' 1 length a1 b1 'color' 'red' set gca 'color' 'white' text 200 1 6 'Xn' ylim 0 2 xlim 0 xmax set gca 'XTick' ; set gca 'YTick' subplot 6 1 3 a1 conv a1 f ; b1 conv b1 f ; plot 1 length a1 a1+b1 'color' 'green' 'linewidth' 2 set gca 'color' 'white' text 200 1 6 'Xn hn' ylim 0 2 max a1 xlim 0 xmax set gca 'XTick' ; set gca 'YTick' subplot 6 1 4 a a a a; b b b b; L 1 length a ; plot L a 'color' 'blue' L b 'color' 'red' set gca 'color' 'white' text 200 2 0 'X_Nn' ylim 0 2 5 xlim 0 xmax set gca 'XTick' 1000 2000 set gca 'XTickLabel' 'N'; '2N' set gca 'YTick' subplot 6 1 5 a1 conv a f ; b1 conv b f ; b1 1 90 b1 3000+1 90 ; L 1 length a1 ; plot L a1 'color' 'blue' L b1 'color' 'red' set gca 'color' 'white' text 200 1 6 'components of X_Nn hn' ylim 0 2 max a1 xlim 0 xmax set gca 'XTick' ; set gca 'YTick' subplot 6 1 6 c a1+b1; L length c ; k 1100; plot 1 k c 1 k 'color' 'red' k+ 1 900 c k+ 1 900 'color' 'green' 'linewidth' 2 k+900+1 xmax c k+900+1 xmax 'color' 'red' set gca 'color' 'white' text 200 1 6 'X_Nn hn' ylim 0 2 max a1+b1 xlim 0 xmax set gca 'XTick' ; set gca 'YTick' </source> Convolution | ||||