MAKE A MEME
View Large Image
| View Original: | Carbon basic phase diagram.png (672x509) | |||
| Download: | Original | Medium | Small | Thumb |
| Courtesy of: | commons.wikimedia.org | More Like This | ||
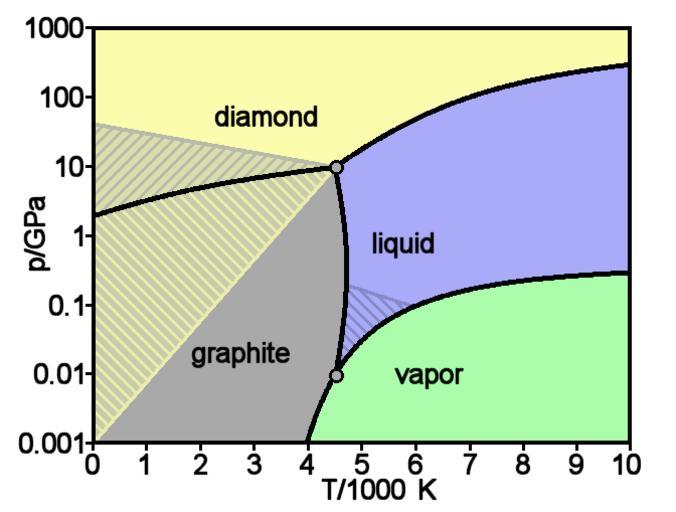
| Keywords: Carbon basic phase diagram.png Theoretical phase diagram of carbon which shows the state of matter for varying temperatures and pressures The hatched regions indicate conditions under which one phase is metastable so that two phases can coexist Accurate illustration but not a pixel-exact plot Also note that a considerable disagreement exists between theory and experiment e g for the triple point 10 1016/0008-6223 76 90010-5 Adapted from a diagram at http //lbruno home cern ch/lbruno/documents/Bibliography/LHC_Note_78 pdf J M Zazula On Graphite Transformations at High Temperature and Pressure Induced by Absorption of the LHC Beam 1997 as based on F P Bundy Pressure-Temperature Phase Diagram of Elemental Carbons Physica A 156 169 1989 J Steinback et al A Model for Pulsed Laser Melting of Graphite J Appl Phys 58 11 4374 1985 Source English Wikipedia original upload 16 April 2005 by Femto en Image Carbon basic phase diagram png en English Wikipedia Femto Carbon phase diagrams Carbon-phase-diagramp svg | ||||