MAKE A MEME
View Large Image
| View Original: | Bombvschernobyldoserateinopenair.png (979x598) | |||
| Download: | Original | Medium | Small | Thumb |
| Courtesy of: | commons.wikimedia.org | More Like This | ||
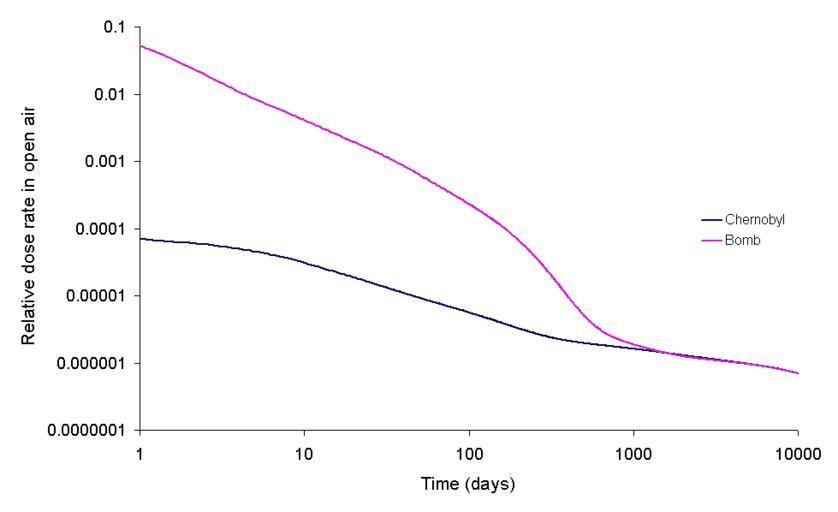
| Keywords: Bombvschernobyldoserateinopenair.png This is a graph drawn using data calculated using a method similar to that of T Imanaka S Fukutani M Yamamoto A Sakaguchi and M Hoshi J Radiation Research 2006 47 Suppl A121-A127 for calculating the dose due to the bomb fall out which calculated for a surface burst with no separation of the different isotopes <sup>131</sup>I <sup>133</sup>I <sup>132</sup>Te <sup>133</sup>I <sup>135</sup>I <sup>140</sup>Ba <sup>95</sup>Zr <sup>97</sup>Zr <sup>99</sup>Mo <sup>99m</sup>Tc <sup>103</sup>Ru <sup>105</sup>Ru <sup>106</sup>Ru <sup>142</sup>La <sup>143</sup>Ce <sup>137</sup>Cs <sup>91</sup>Y <sup>91</sup>Sr <sup>92</sup>Sr <sup>128</sup>Sb and <sup>129</sup>Sb are the gamma emitters which have been conisdered for the bomb fallout The fission was assumed to have been caused by 1 MeV neutrons and 20 occurred in the <sup>238</sup>U tamper of the bomb the dose does not include the effect of any shielding The data was from the Korean table of the isotopes For the chernobyl fallout The contributions made by the different isotopes to the dose in air caused in the contaminated area in the time shortly after the accident Note that this image was drawn using data from the OECD report the Korean table of the isotopes and the second edition of 'The radiochemical manual' Data on the release was taken from the following two sources It was assumed that the whole release occurred on the first day in an instant A short report on the release of radioisotopes from the site is on the OSTI web site<ref>http //www osti gov/energycitations/product biblio jsp osti_id 5087075 Chernobyl source term atmospheric dispersion and dose estimation EnergyCitationsDatabase November 1 1989</ref> A more detailed report can be downloaded from the OECD web site's public library<ref>http //hermia sourceoecd org/nw 1/rpsv/~4292/v3n1/s1/p1l OECD Papers Volume 3 Issue 1 OECD 2003</ref> as a 1 85MB PDF file <references/> See the graphs on the trinity glass in J Environmental Radioactivity w Image Bombvschernobyldoserateinopenair jpg 2006-07-22 wikipedia en user Cadmium en wikipedia Cadmium w Image Bombvschernobyldoserateinopenair jpg Nuclear fallout Chernobyl disaster Diagrams by user Cadmium | ||||