MAKE A MEME
View Large Image
| View Original: | BivariateOutlier.png (700x700) | |||
| Download: | Original | Medium | Small | Thumb |
| Courtesy of: | commons.wikimedia.org | More Like This | ||
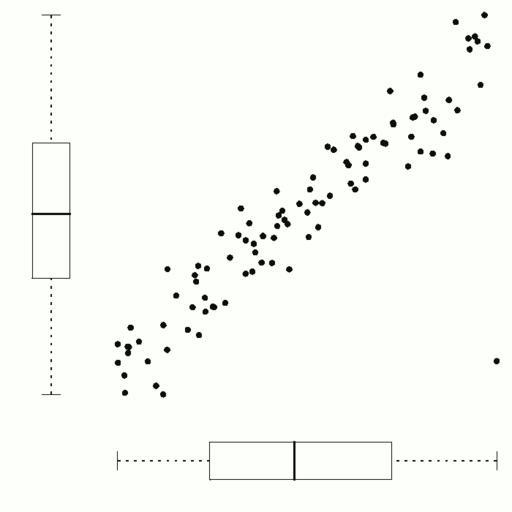
| Keywords: BivariateOutlier.png graph en Shows in the lower right corner an outlier which can not be detected by univariate inspection own Sigbert 2009-10-26 n <- 99 s <- 0 1 x <- runif n y <- x+s rnorm n x <- c x 1 y <- c y 0 par mai c 0 0 0 0 par fig c 0 2 1 0 2 1 plot x y pch 19 axes FALSE par fig c 0 2 1 0 0 2 new TRUE boxplot x horizontal TRUE axes FALSE par fig c 0 0 2 0 2 1 new TRUE boxplot y axes FALSE Created with R Scatterplots Box plots Outliers | ||||