MAKE A MEME
View Large Image
| View Original: | 3D Graph of LMS Color Space.png (1875x1311) | |||
| Download: | Original | Medium | Small | Thumb |
| Courtesy of: | commons.wikimedia.org | More Like This | ||
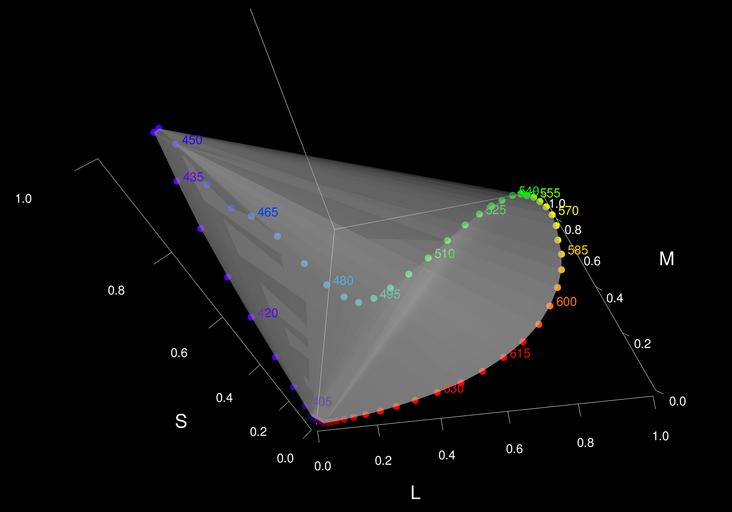
| Keywords: 3D Graph of LMS Color Space.png en A 3D Graph of LMS Colorspace derived from 'StockmanMacLeodJohnson2degCIEadjConeFundamentals1993' from the R package 'color science' The boundary of colored dots represent the spectrum locus and the interior grey volume represents the space of colors The colors of the dots are representations of true colors that cannot be represented accurately on an electronic display or printed sheet The R source for generating this graph is available at https //github com/mittimithai/colorspacegraphs 2016-11-09 own Maneesh other versions cc-zero Color vision | ||||