MAKE A MEME
View Large Image
| View Original: | 1999-2014 UK exports destination share graph.png (981x459) | |||
| Download: | Original | Medium | Small | Thumb |
| Courtesy of: | commons.wikimedia.org | More Like This | ||
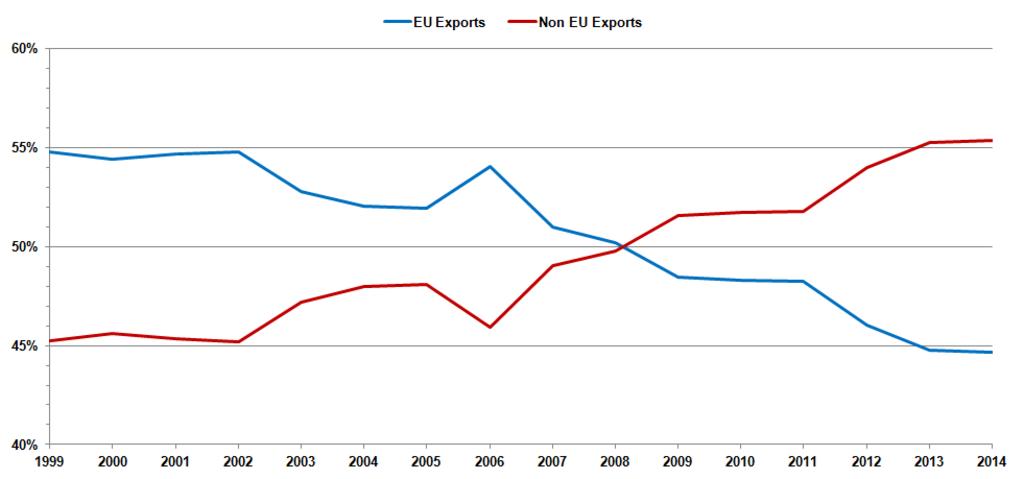
| Keywords: 1999-2014 UK exports destination share graph.png en Connected scatter graph showing the United Kingdom's exports between EU and non-EU countries from the year 1999 through to 2014 2016-03-03 http //webarchive nationalarchives gov uk/20160105160709/http //www ons gov uk/ons/rel/international-transactions/outward-foreign-affiliates-statistics/how-important-is-the-european-union-to-uk-trade-and-investment-/chd-eu-fig-2 xls Office for National Statistics 26 June 2015 Jolly Janner other versions <gallery> File 1999-2014 UK exports destination graph png Exports absolute File 1999-2014 UK exports destination share graph png Exports share File 1999-2014 UK imports origin graph png Imports absolute File 1999-2014 UK imports origin share graph png Imports share File 1999-2014 UK foreign trade graph png Combined absolute File 1999-2014 UK foreign trade share graph png Combined share </gallery> Data wikitable - Year EU Exports Non EU Exports - 1999 54 8 45 2 - 2000 54 4 45 6 - 2001 54 7 45 3 - 2002 54 8 45 2 - 2003 52 8 47 2 - 2004 52 0 48 0 - 2005 51 9 48 1 - 2006 54 1 45 9 - 2007 51 0 49 0 - 2008 50 2 49 8 - 2009 48 4 51 6 - 2010 48 3 51 7 - 2011 48 2 51 8 - 2012 46 0 54 0 - 2013 44 8 55 2 - 2014 44 6 55 4 cc-zero Economic statistics for the United Kingdom | ||||